We share our perspectives and present five long term historical charts including return on invested capital using Russell 3000, which is made of 3000 large US companies, as determined by market capitalization. This portfolio of securities represents approximately 98% of the investable US equity, one of the best proxies of the entire US public companies.
These are a part of the many analyses we have done. Our objective is to research the fundamental drivers of the stock market, i.e., to develop non-biased structural ideas on “What is driving the stock market.”
Chart 1
US public companies have improved capital return spread. Between the dot-com bubble and the financial crisis, the return on capital did not trend upwards, and EVA spread was not positive. Incremental return from capital investment in this period is estimated to be around the cost of capital. After the financial crisis, it needs attention that the return on invested capital increased, which led to a higher EVA spread of around 3%. Then it decreased due partly to the weaker cyclical business environment for energy and commodity materials.
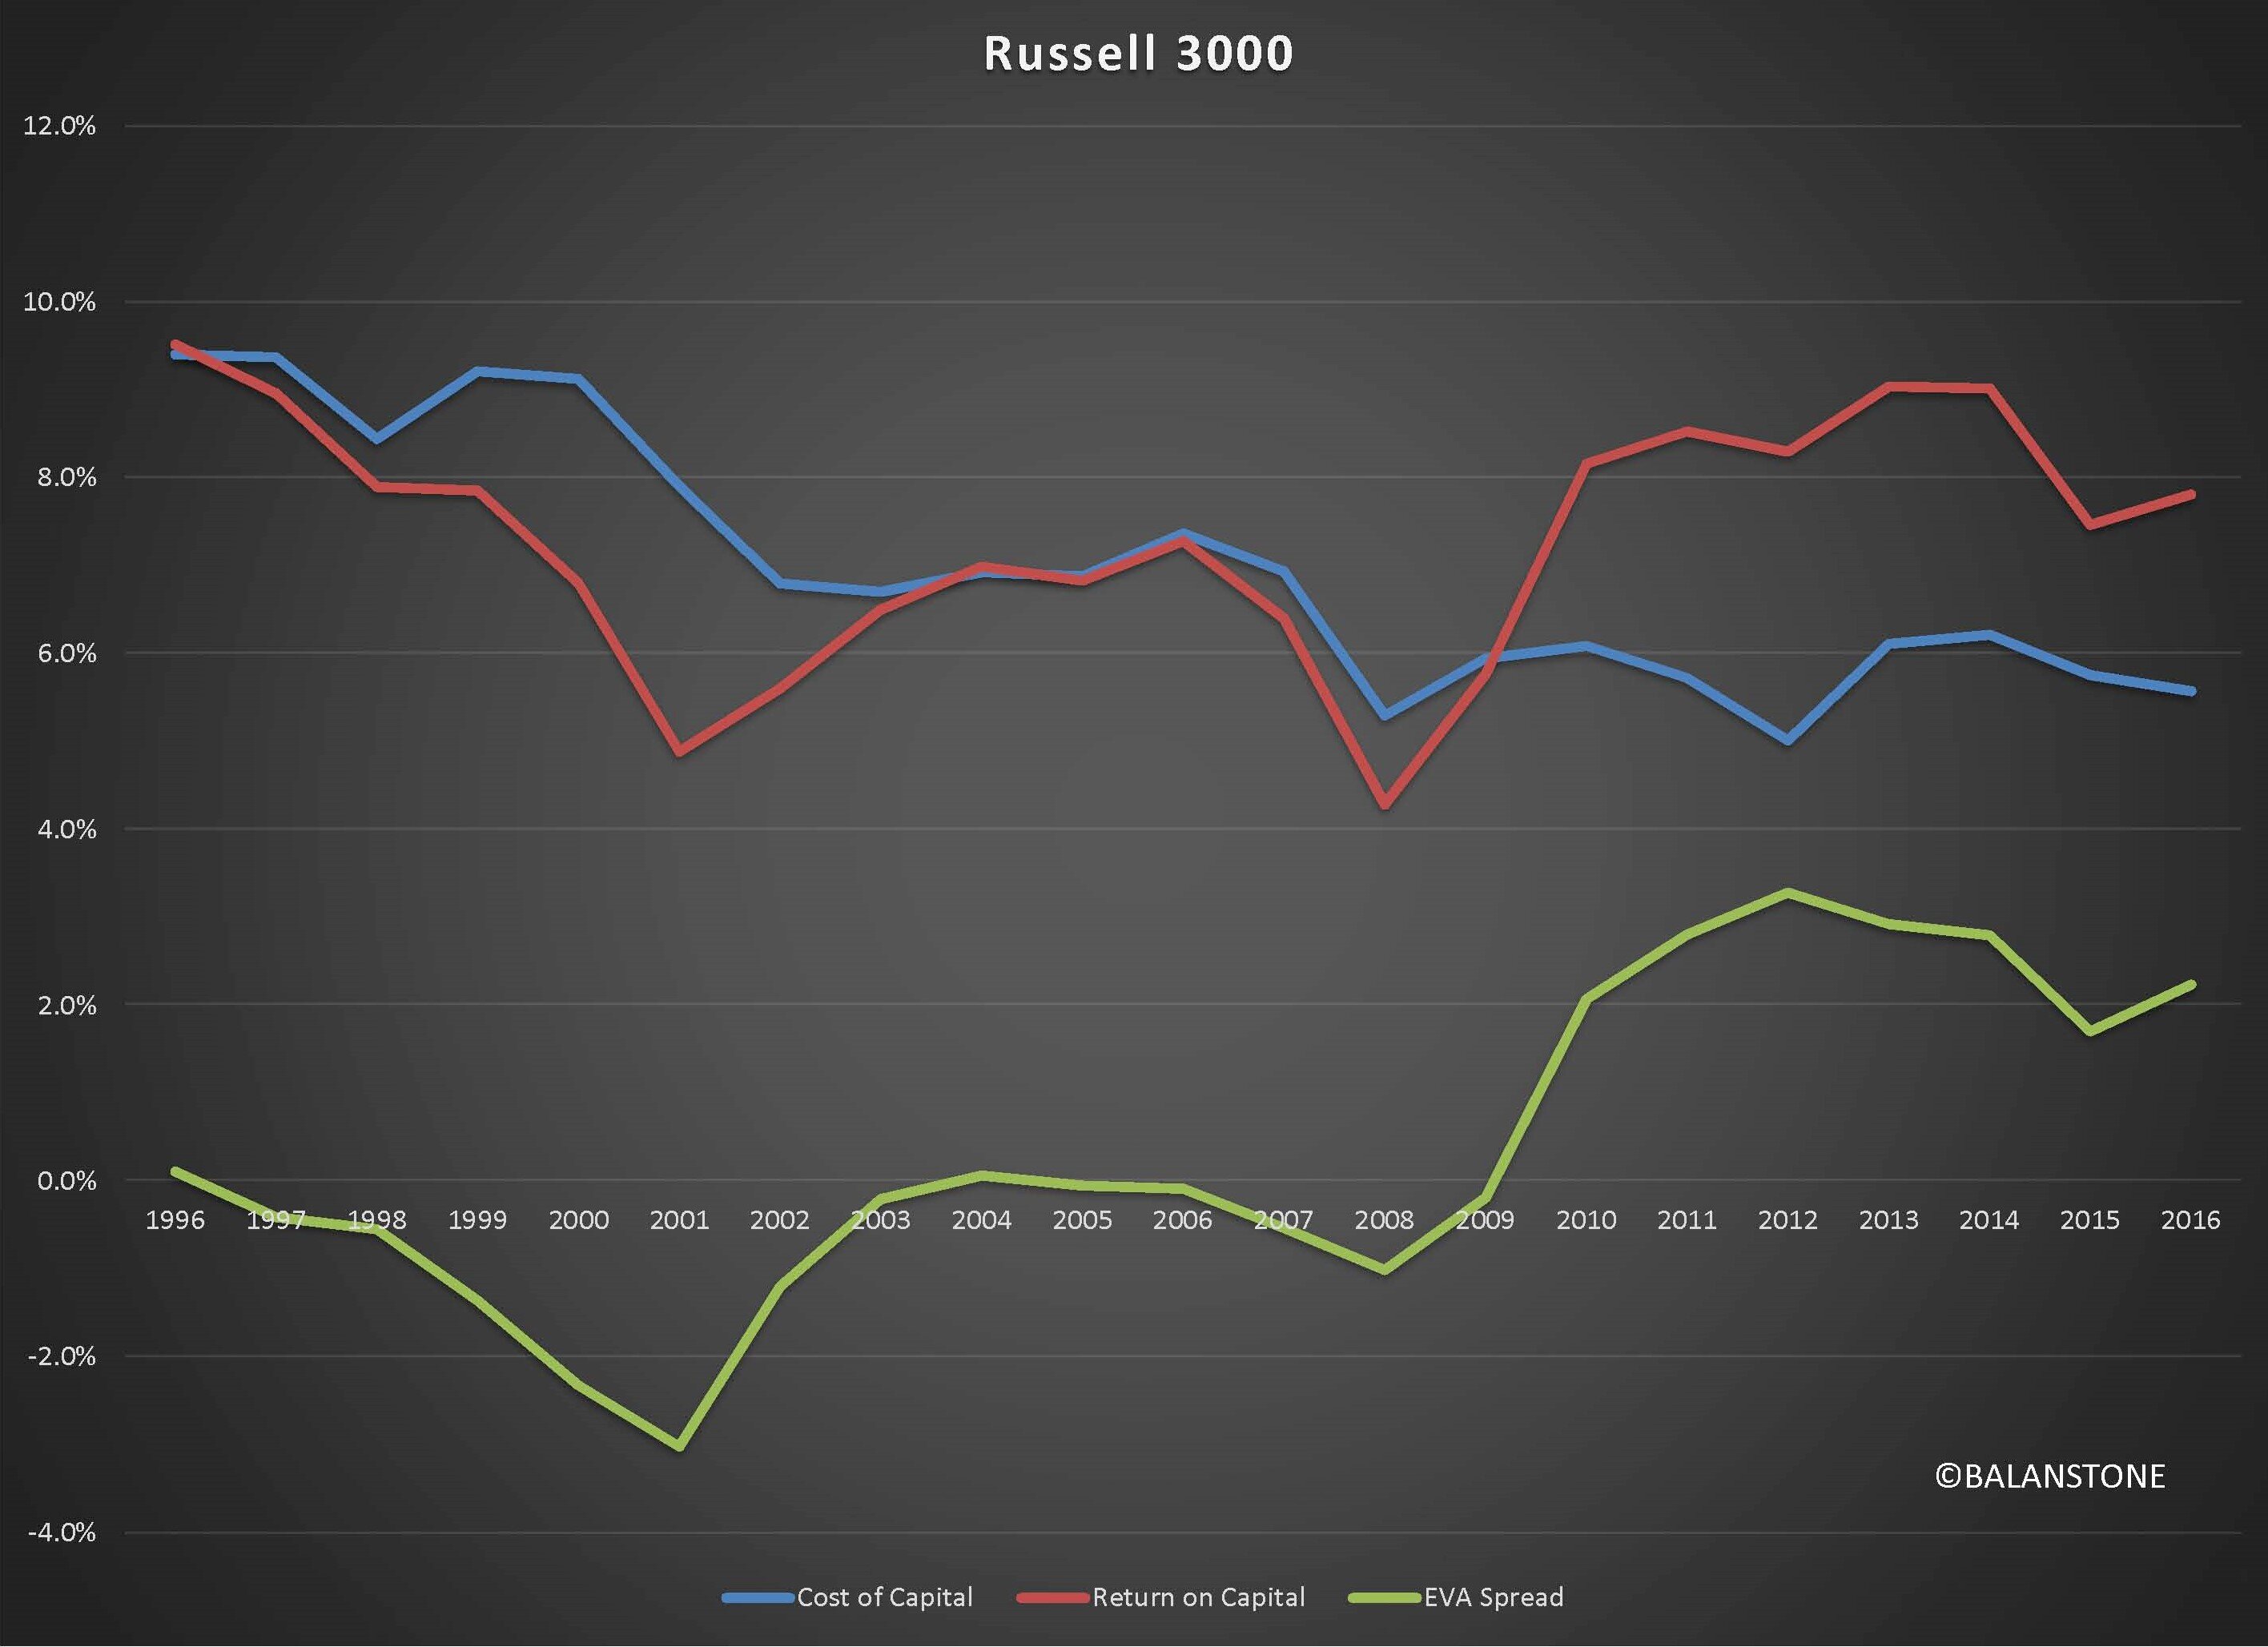
Chart 2
Meanwhile, enterprise and equity valuation measured against free cash flow became less expensive after the financial crisis. Free Cash Flow Yield shows a major shift between the financial crisis. Free Cash Flow to Firm (FCFF) / Enterprise Value (EV) Yield increased to over 5% in 2009. It decreased to less than 4% and became less inexpensive, but it is still above the peak level observed between 1995 and 2007.
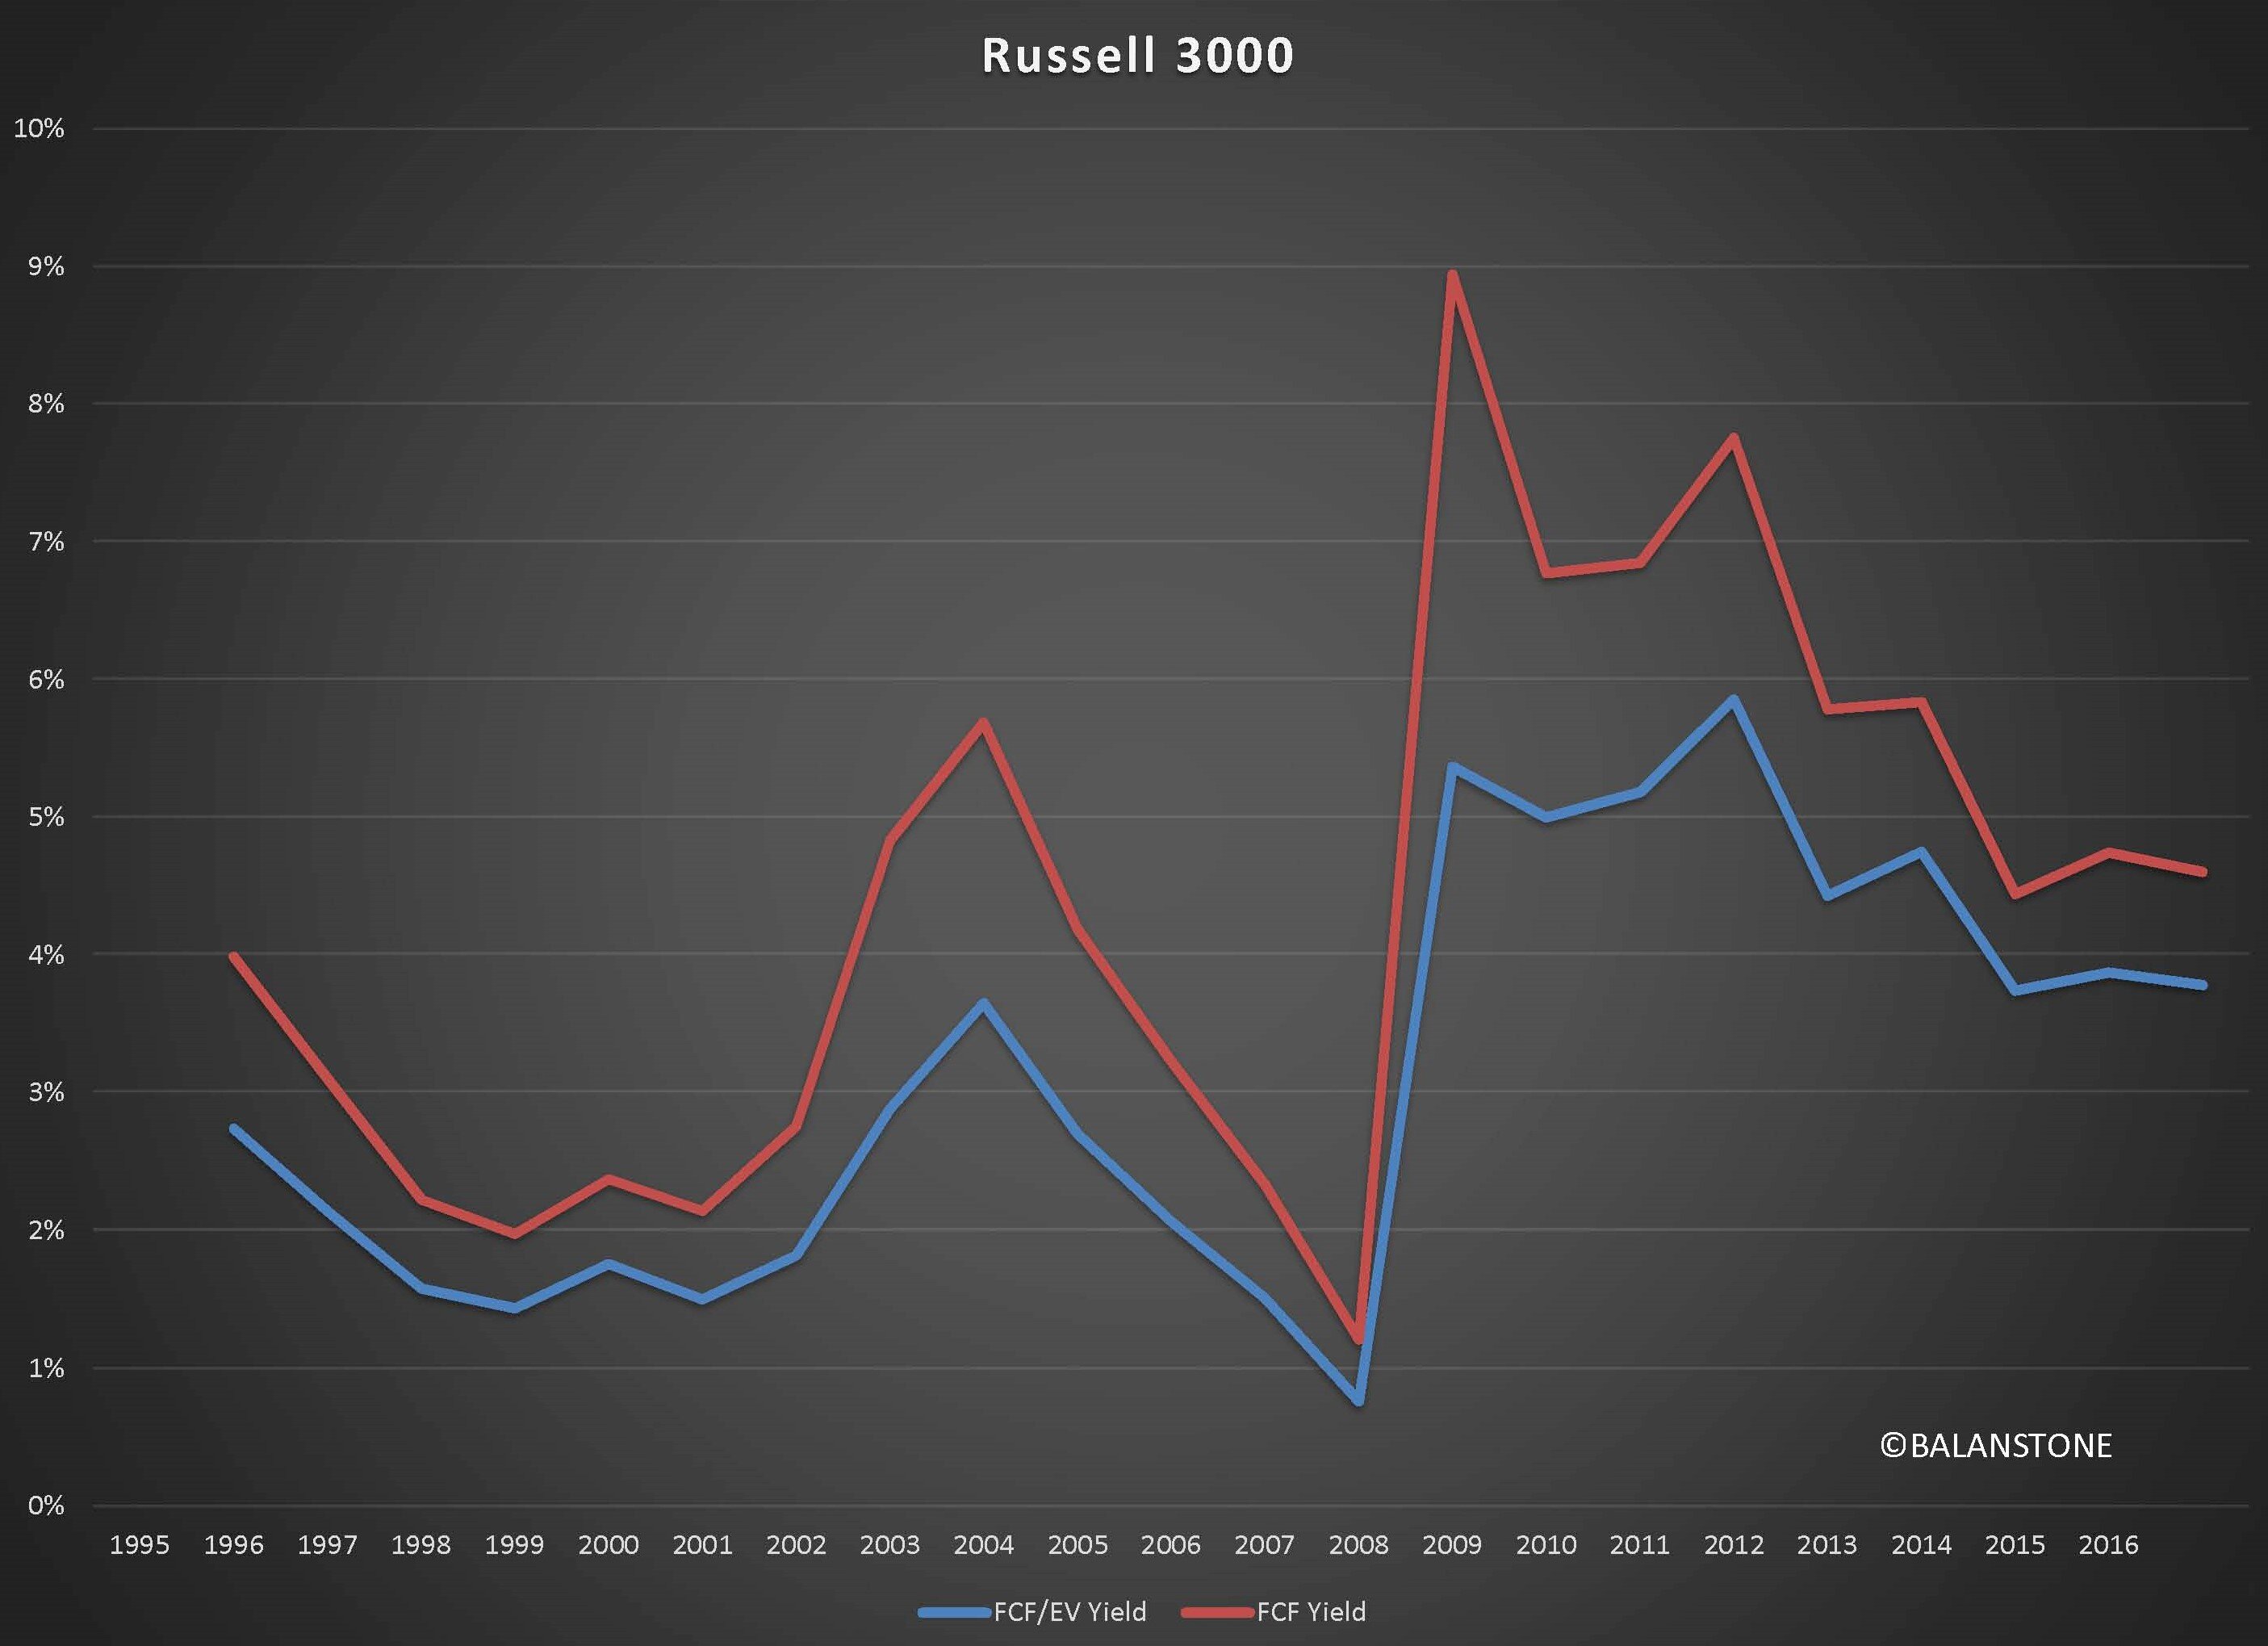
Chart 3
The return on capital has made a round trip and back to where it was 20 years ago. The increase in EVA spread has come mainly from the decline in the cost of debt. It was down by nearly 4% throughout the measured period. It is safe to assume that the cost of debt has an asymmetrical probability distribution in the future, given the limit to the downside of the nominal interest rate. The market and central banks have already learned what sub-zero nominal interest rates would bring to both the financial and corporate markets.
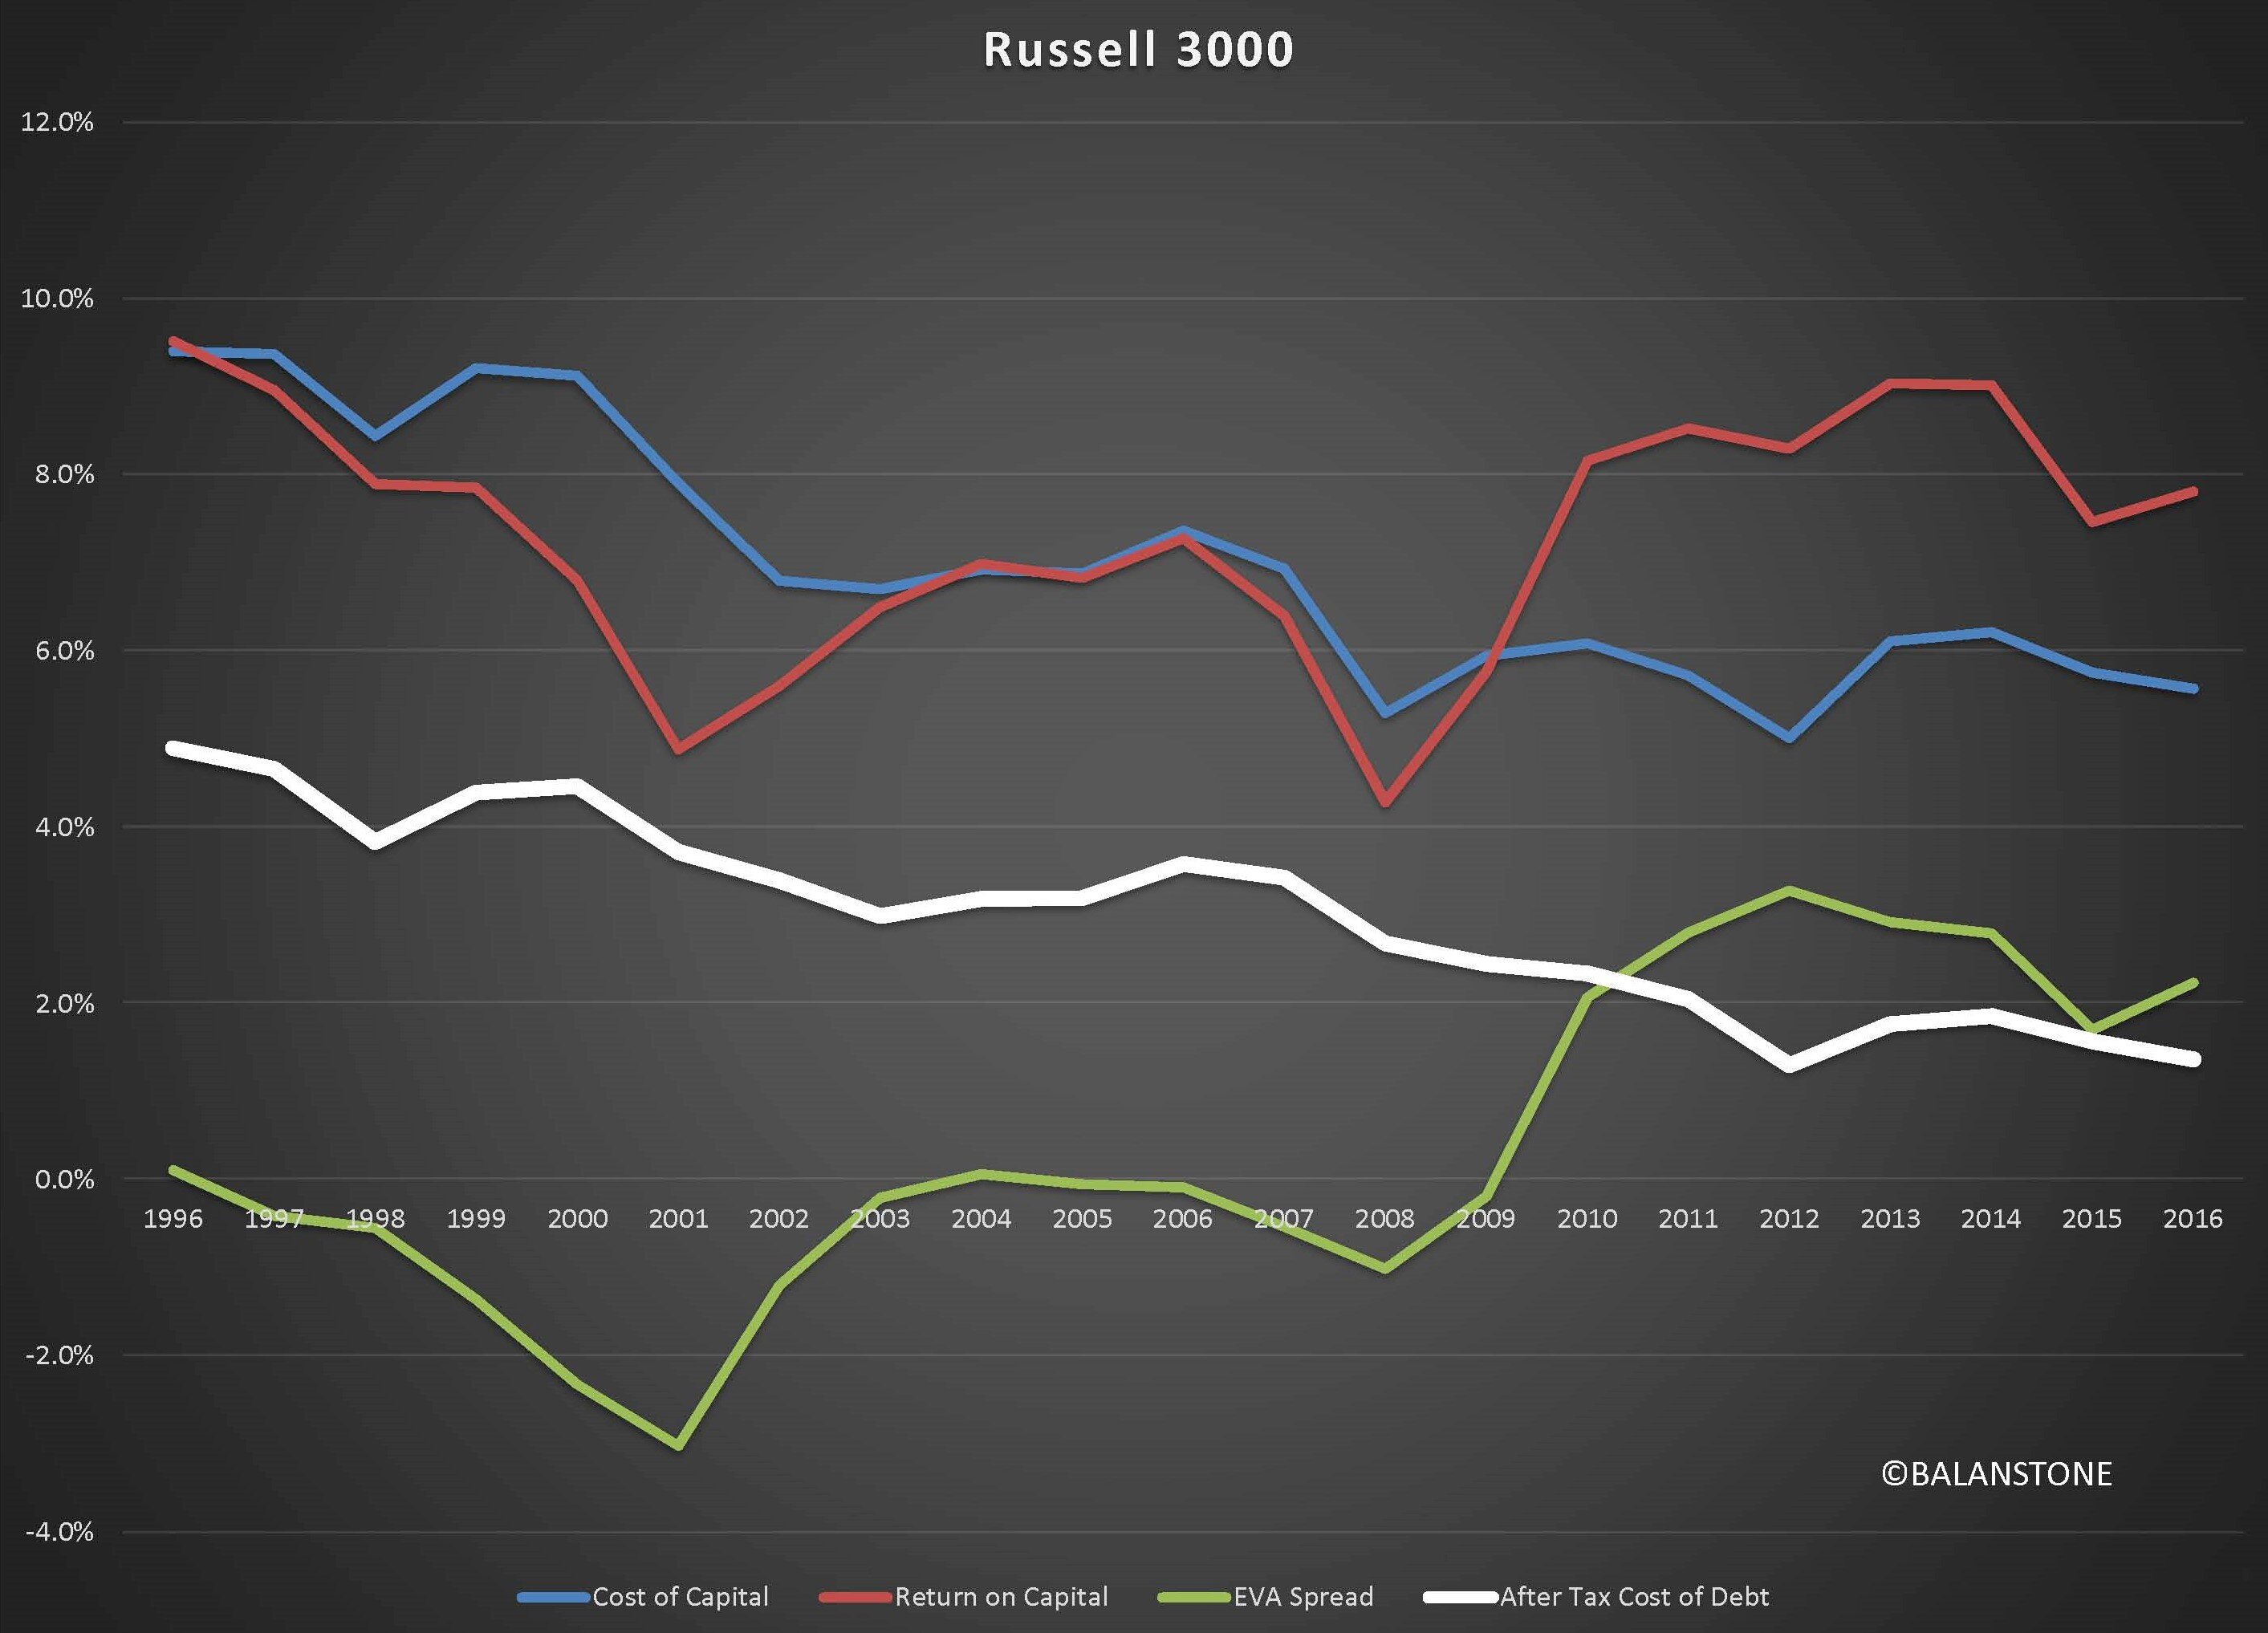
Chart 4
As discussed, the risk-free rate has been trending downward – but the US is holding steady around 2%, showing a sign of the upward move. Both the EU and Japan are still around the ground-zero level. Still, it is not likely to take the same path they had in the last decade unless both central banks can accept the risks of hurting the net interest margin of financial service companies, primarily commercial banks.
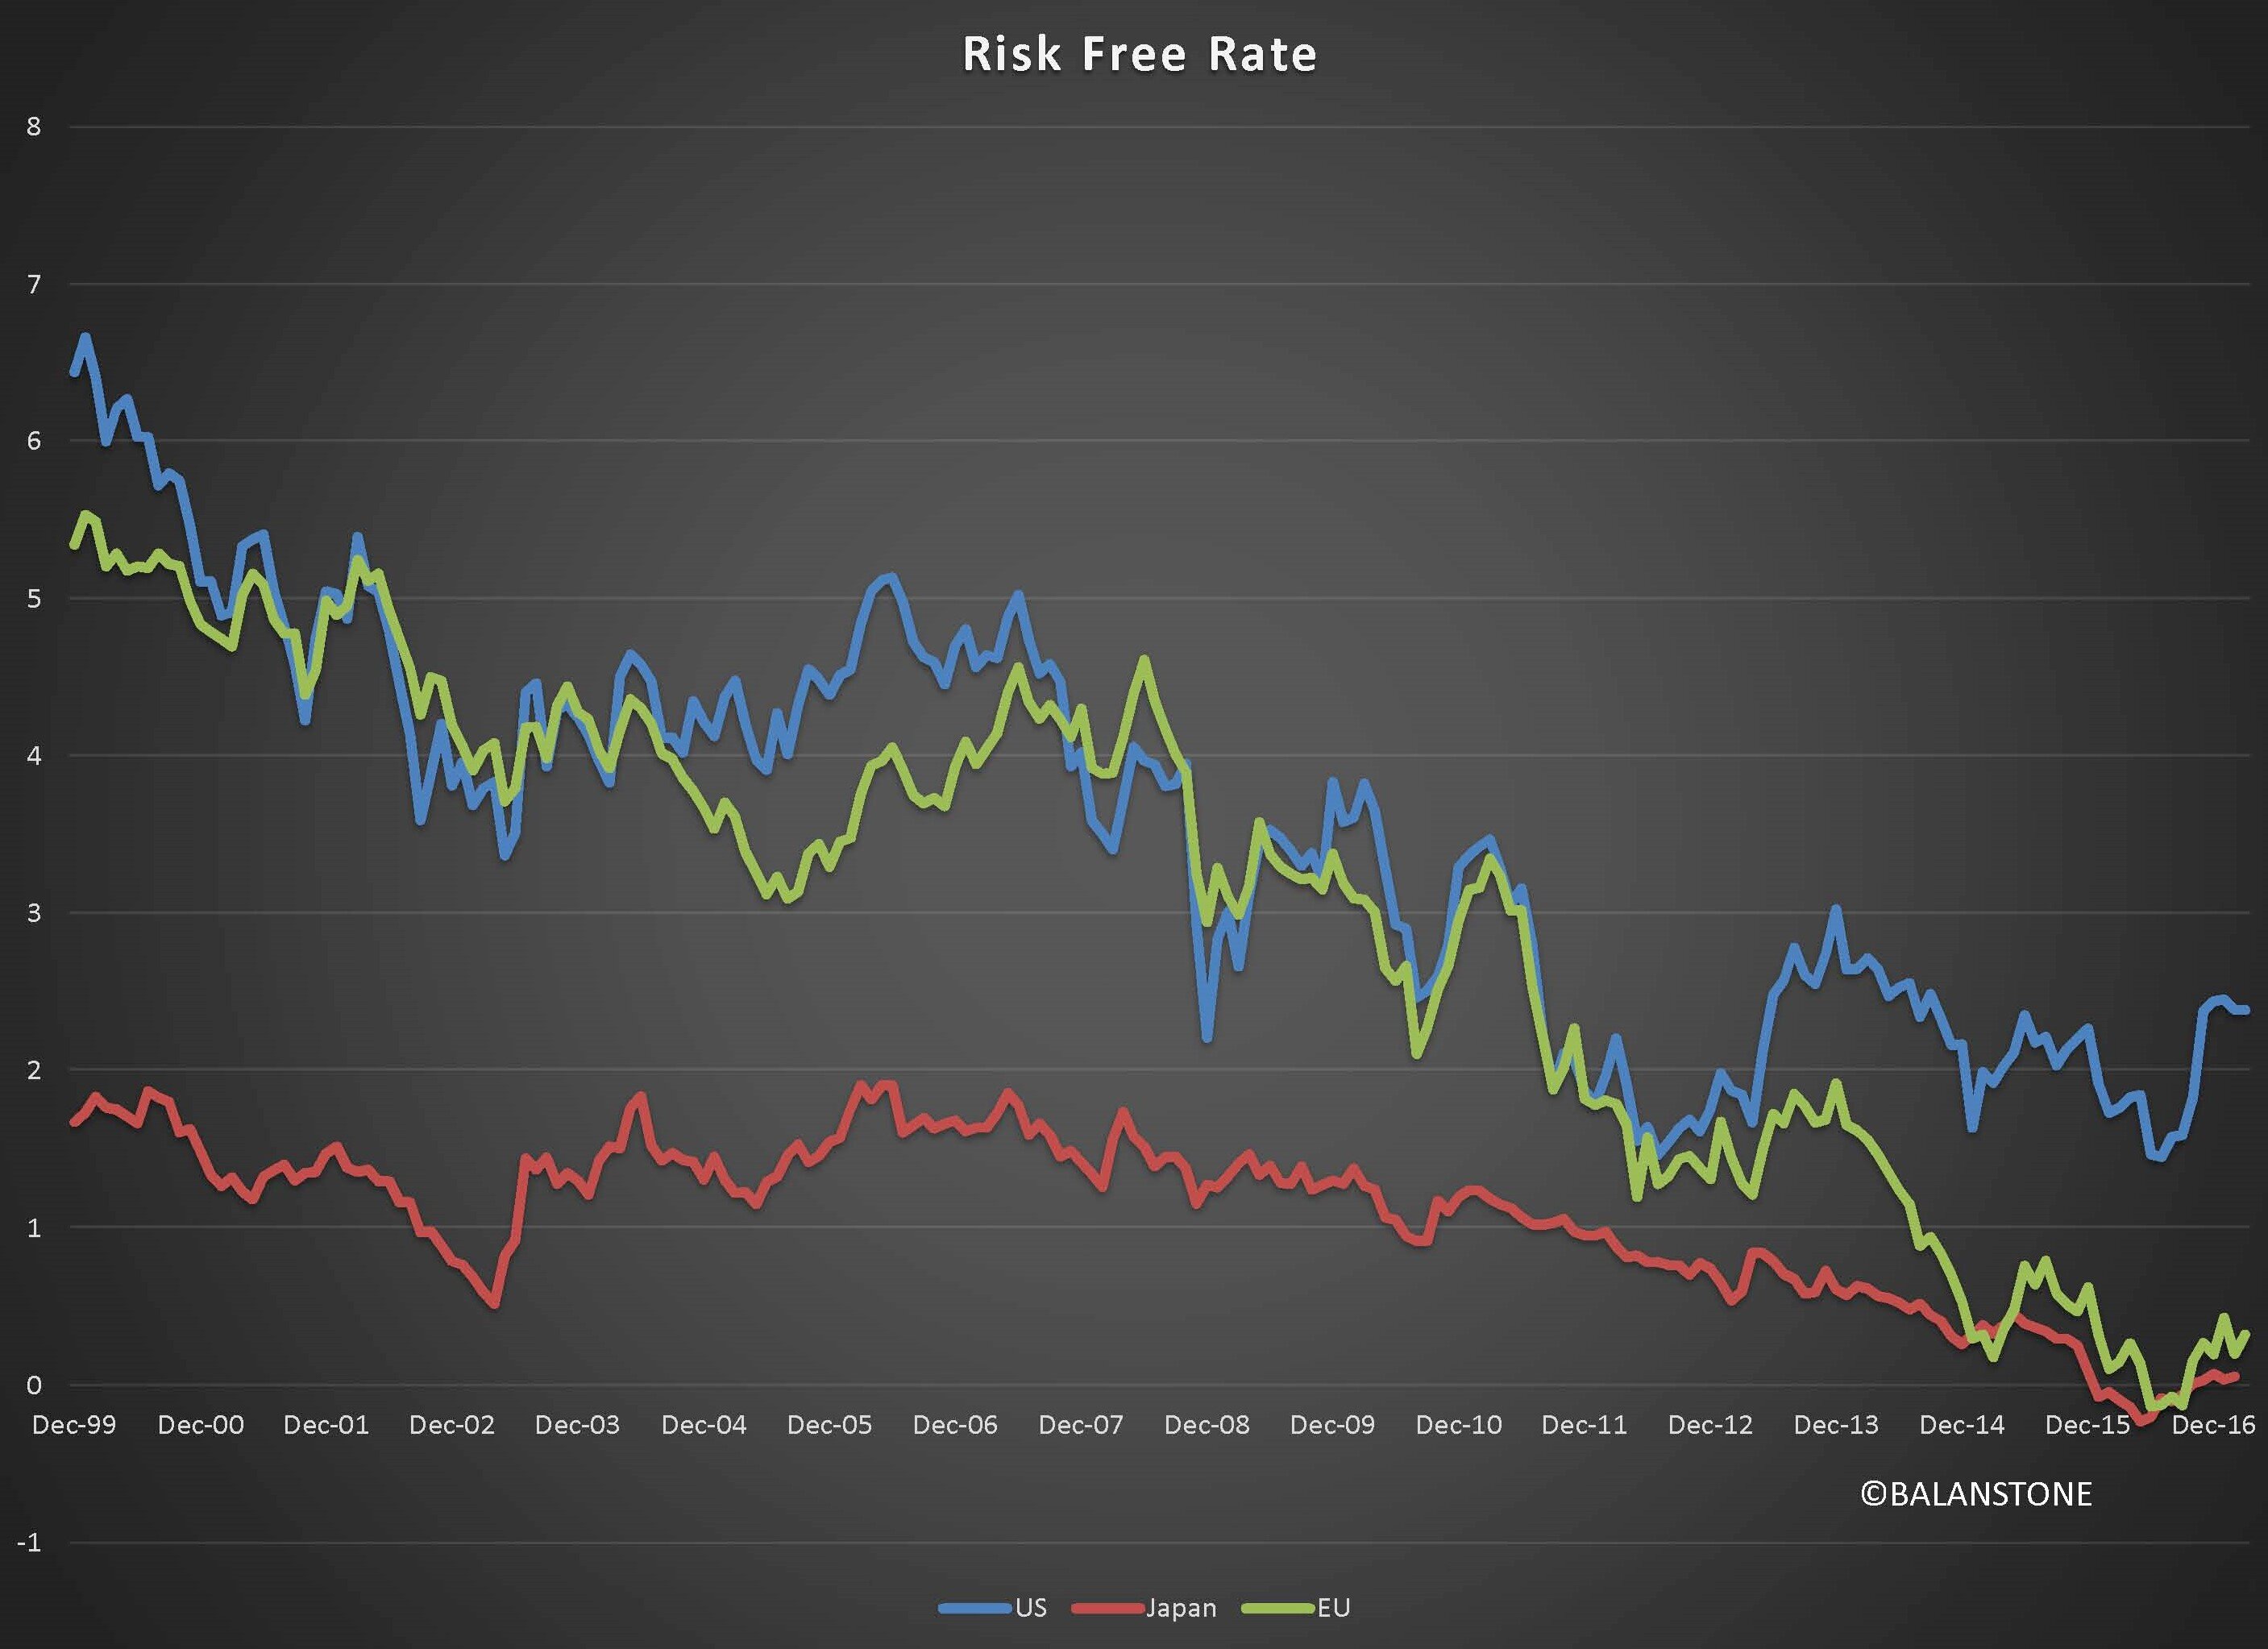
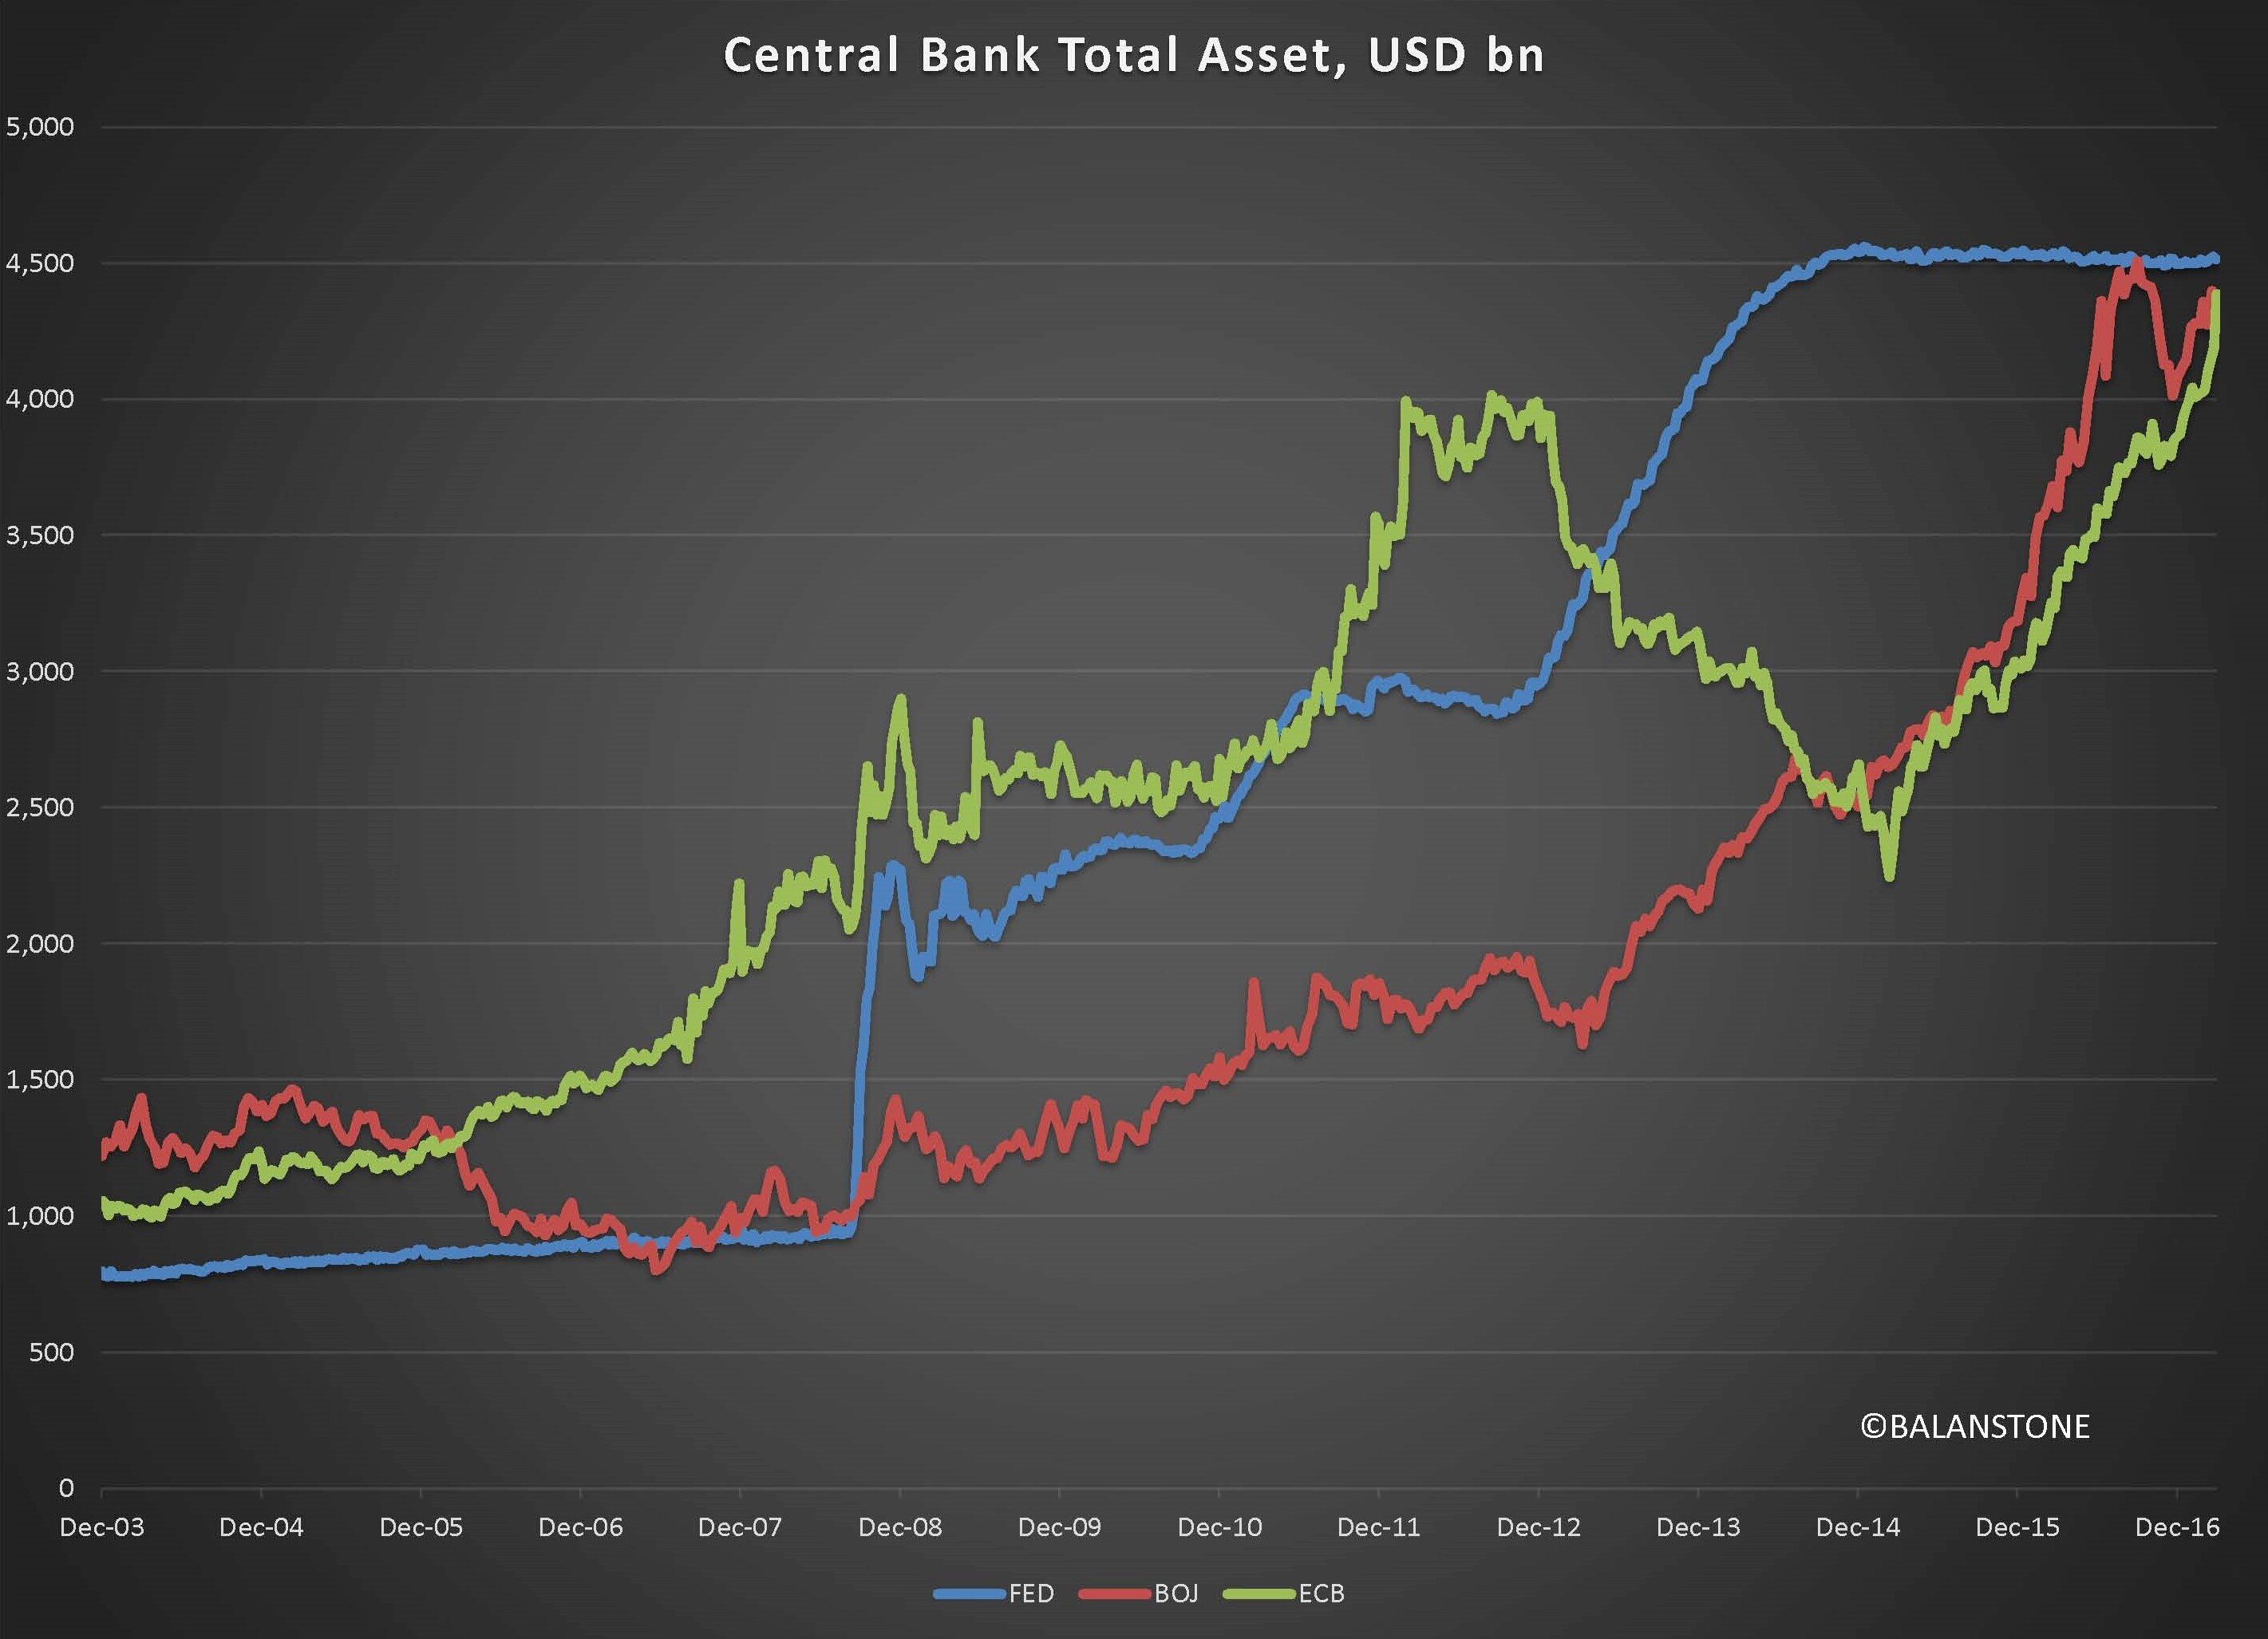
Chart 5
At the same time, all three major central banks now have the same level of total assets. USD 13.5 trillion is almost 2x more significant than in 2010. The changes in natural growth rate and demographics would force them to adopt a new financial model of the central bank. They may keep the current structure. However, this has just started, and the model has not yet established, and the outcome is not predictable, with a high level of certainty. Moreover, its impact will be felt through many routes, including the corporation’s economic profit and the FCFF yield spread.